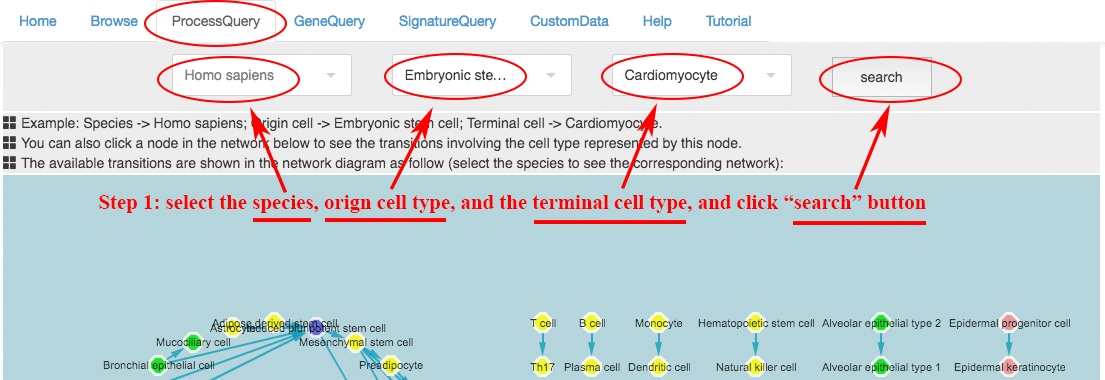
User can submit a gene list obtained from their own studies not only to predict the candidate transitions involving the queried genes, but also functions and gene expression profiles of the queried genes in the candidate datasets from previously studies.
Example:
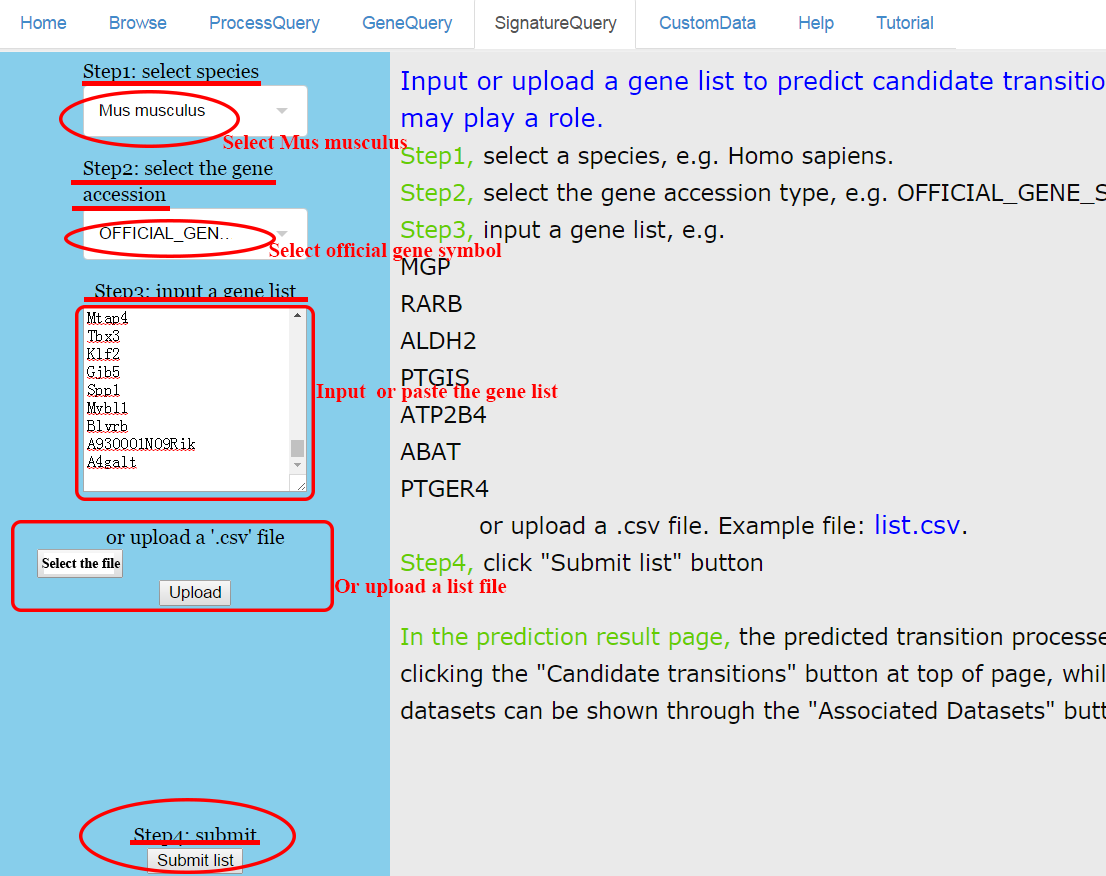
Step 1~4: paste a list of genes and submit. ⇓
The list used in this example consists of 323 transiently either up- or down-regulated genes (clusters IV and VIII) during the reprogramming of mouse embryonic fibroblasts (MEFs) to induced pluripotent stem cells (iPSCs) identified by Polo et al (Polo, J., Anderssen, E., Walsh, R., Schwarz, B., Nefzger, C., Lim, S.M., Borkent, M., Apostolou, E., Alaei, S. and Cloutier, J. (2012) A Molecular Roadmap of Reprogramming Somatic Cells into iPS Cells. Cell, 151, 1617-1632). ⇓

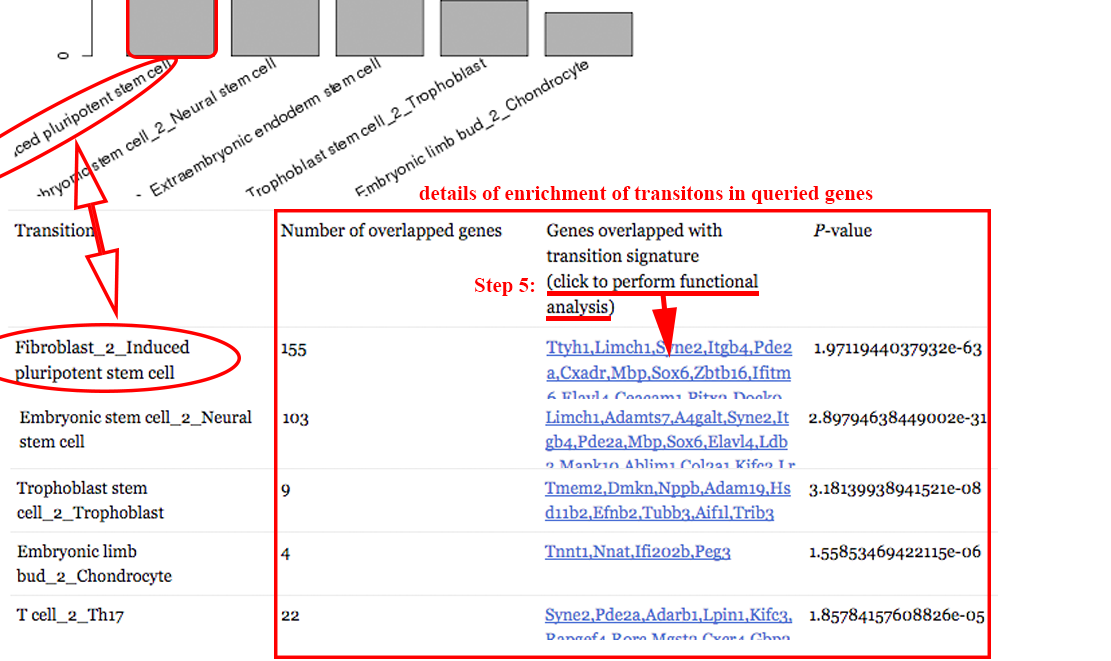
CSTEA recovers the transition process from fibroblast to iPSCs and shows the relevant queried genes. ⇓
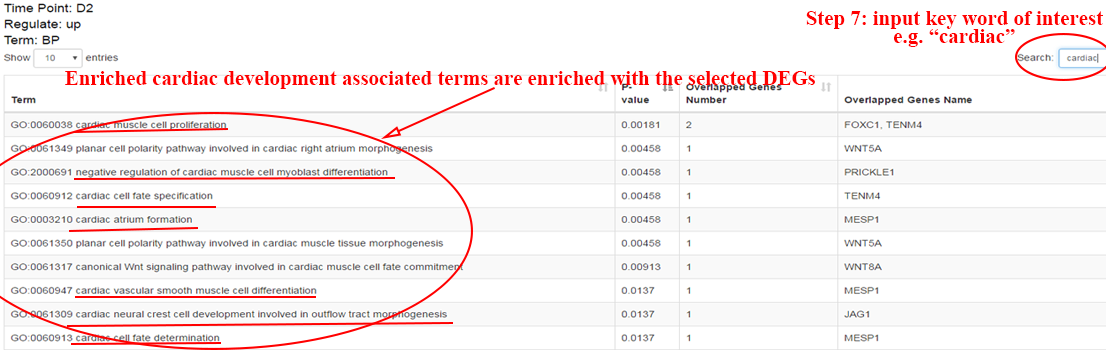
Step 5: perform functional enrichment analysis on overlapped genes to reveal the functions of these important genes. ⇓
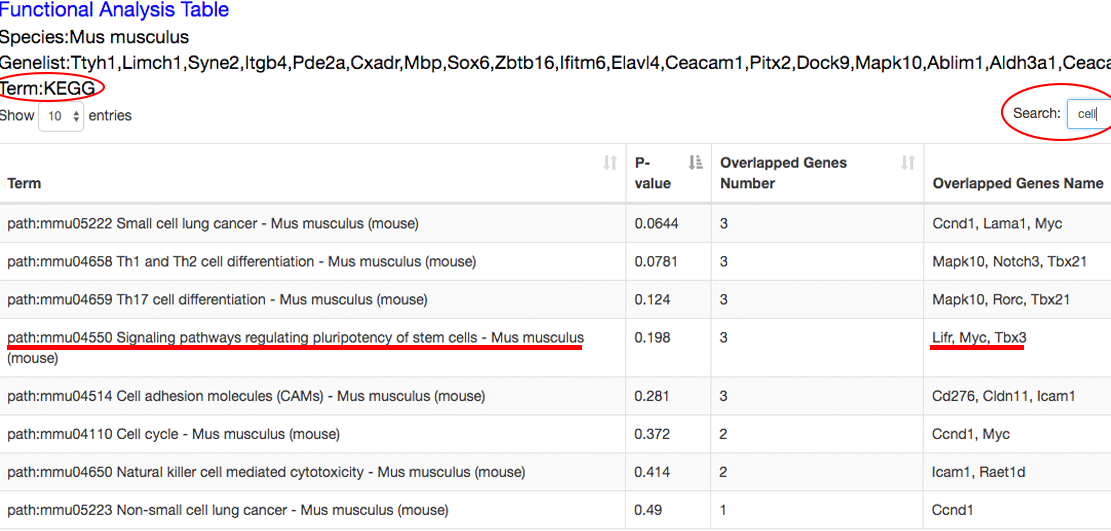
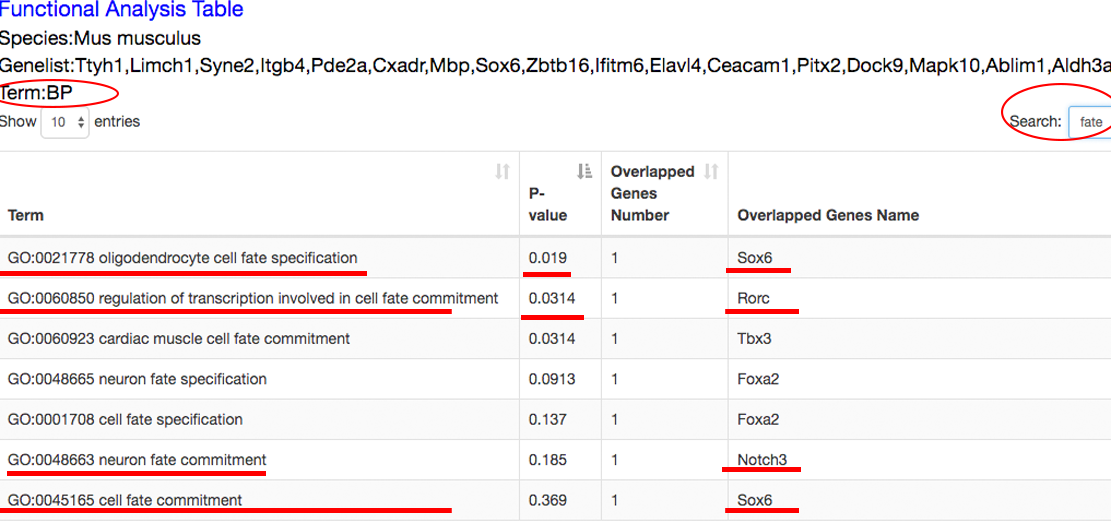
The functional analysis reveals the candidate transition-associated genes annotated with transition-associated pathways and biological processes. ⇓
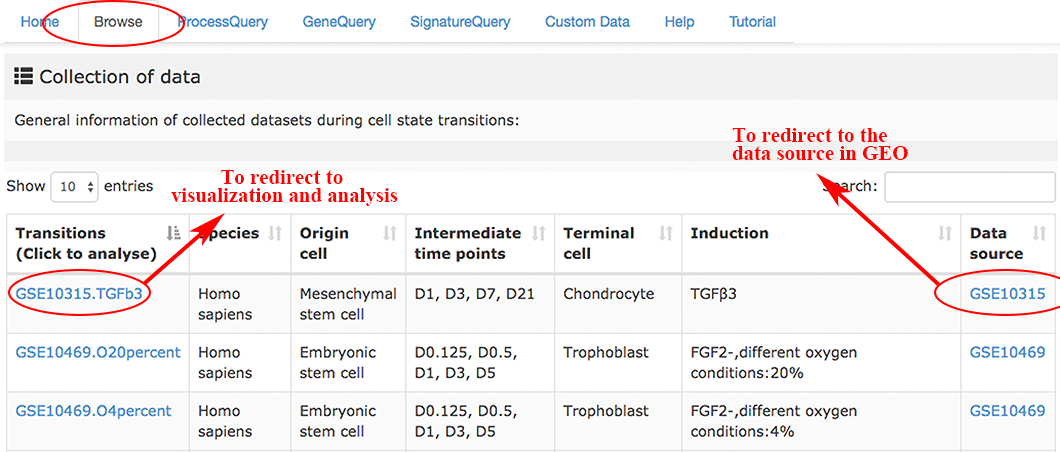
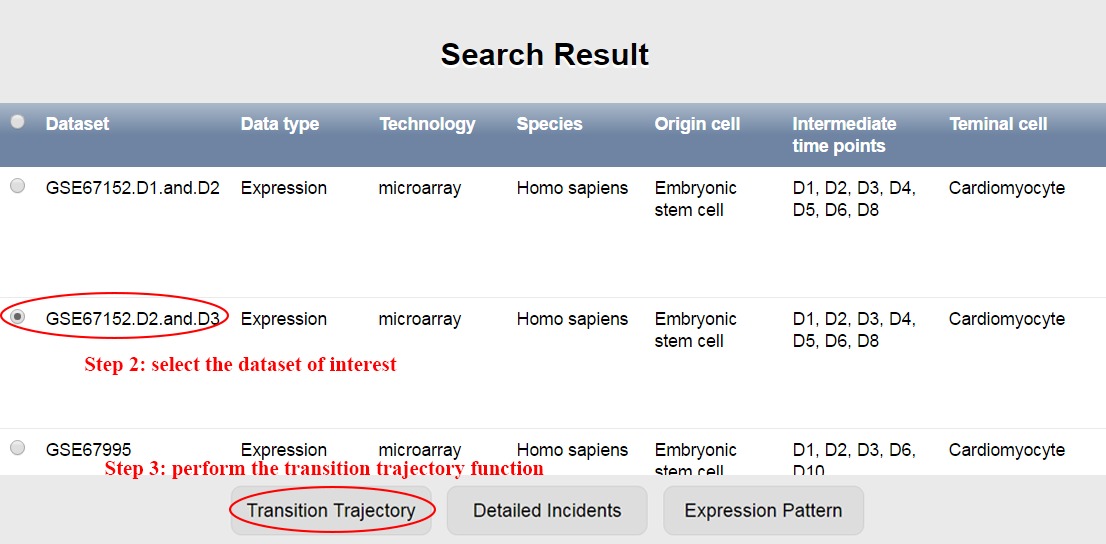
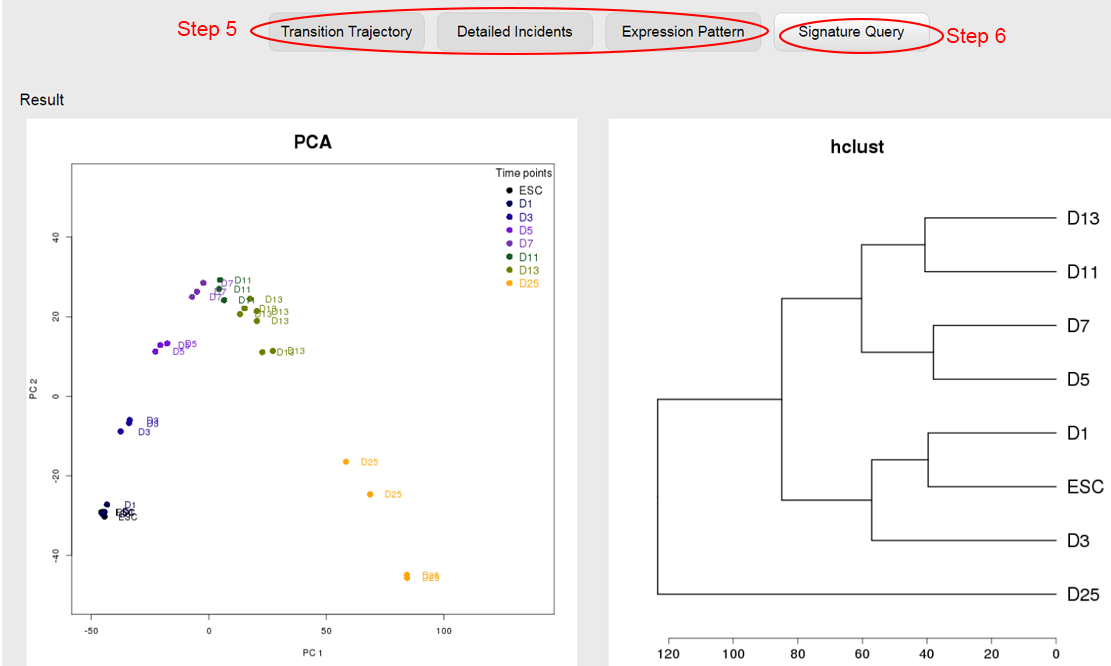
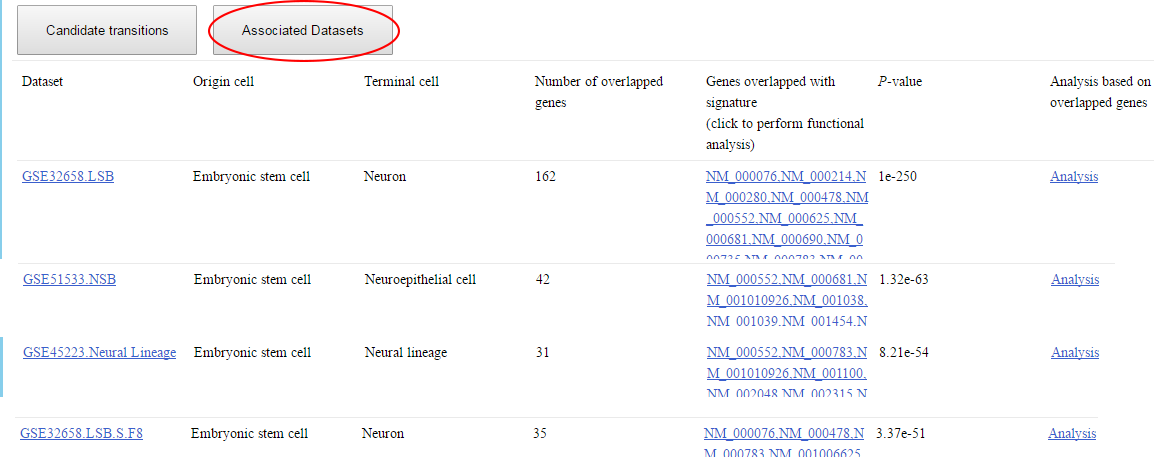
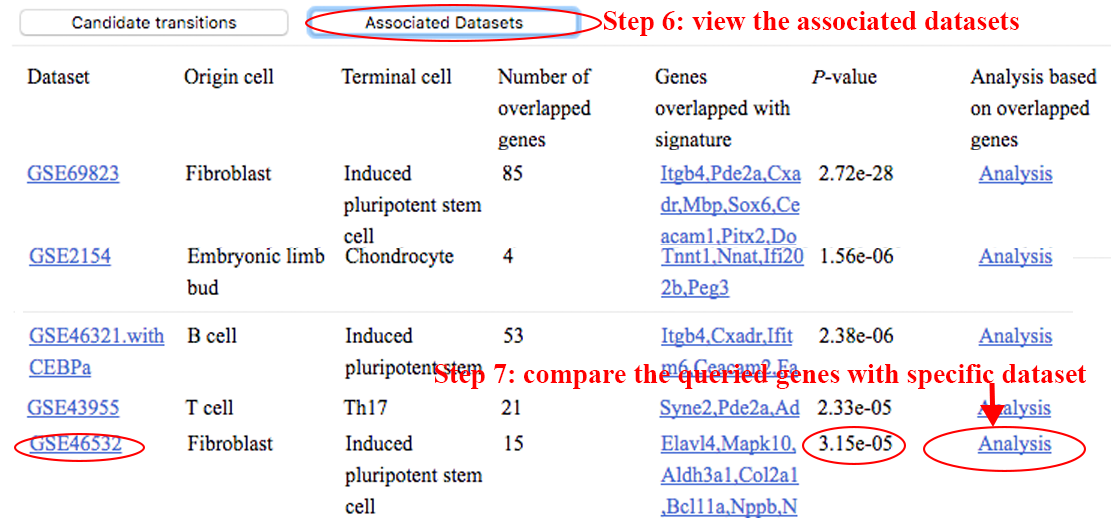
Step 6~7: view the datasets associated with the queried genes, and analyze the roles of these genes at different time points in specific dataset. ⇓
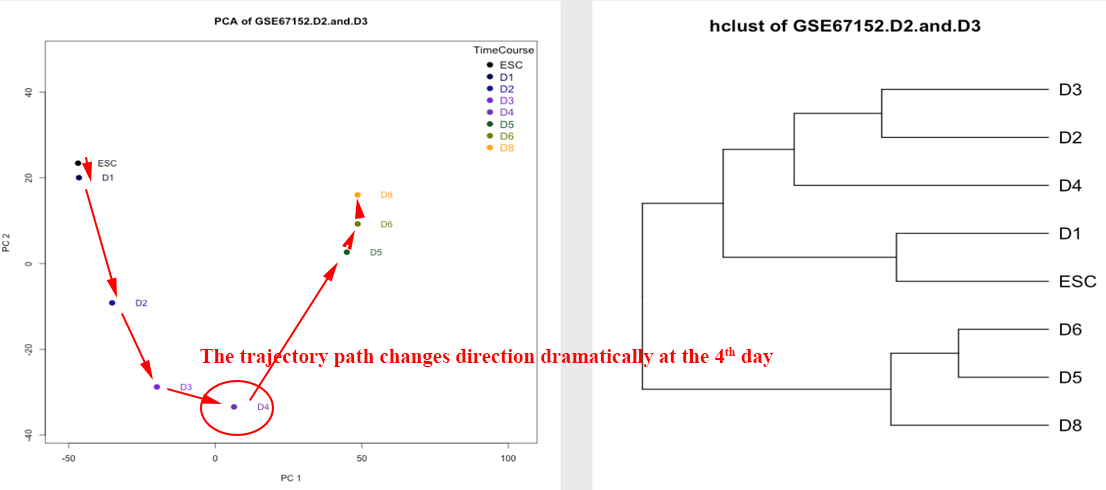
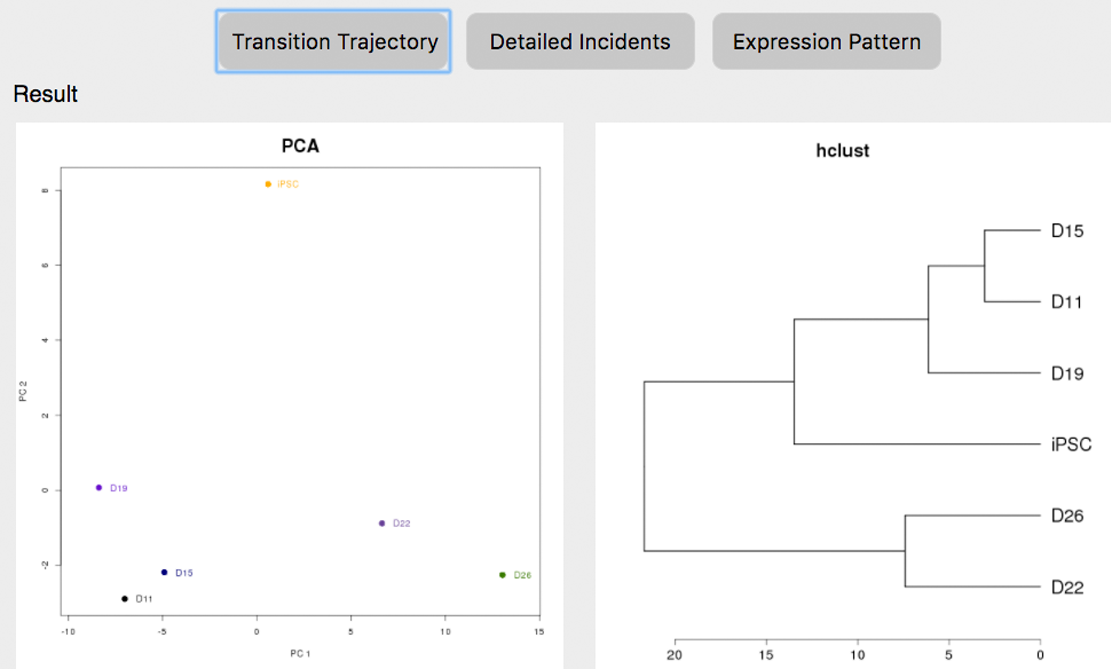
The result page will need 4~10 seconds to initiate, after which the transition trajectory and clustering of samples will be visualized based only on the genes overlapping with the signature defined in the specified dataset (GSE46532 in this case). However, the trajectory based on these overlapped genes may be much different from the one visualized based on all DEGs. limited by the few overlapped genes, the trajectory may not effectively represent the change of transcriptome during the transition. ⇓
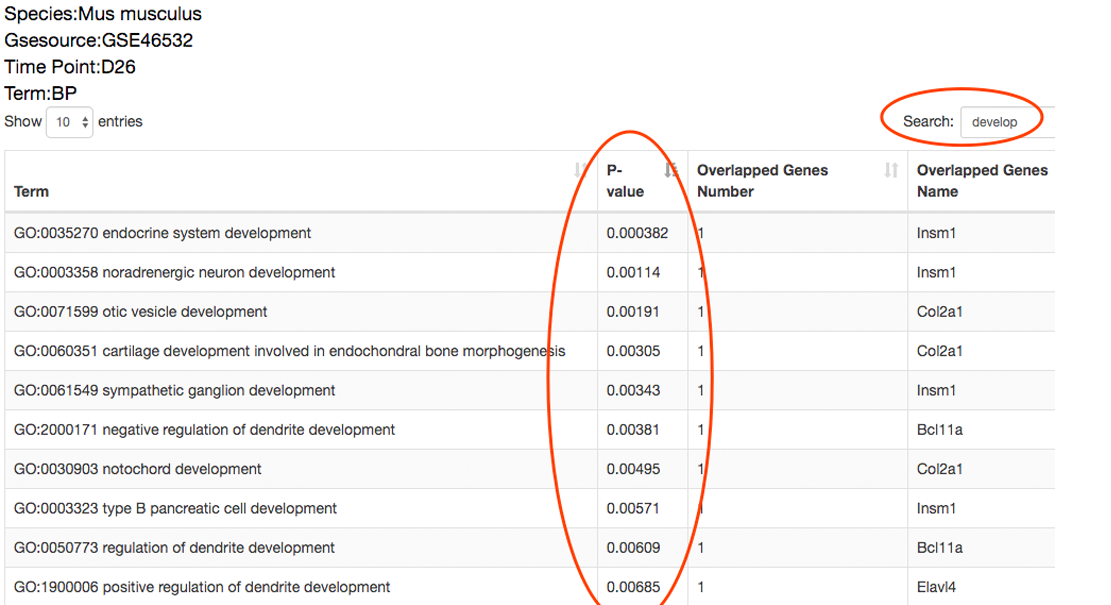
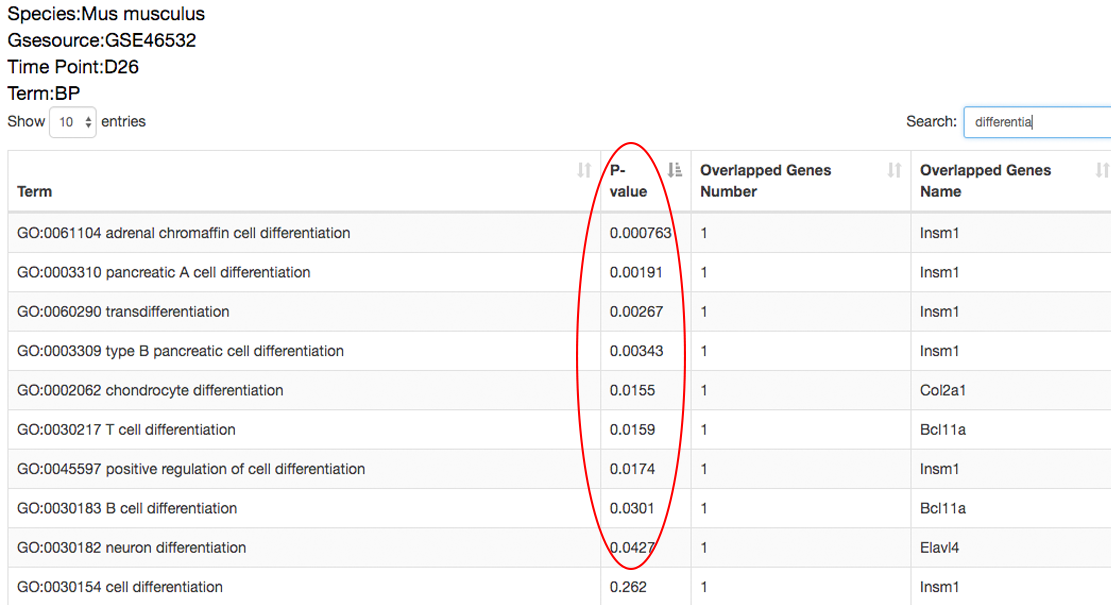
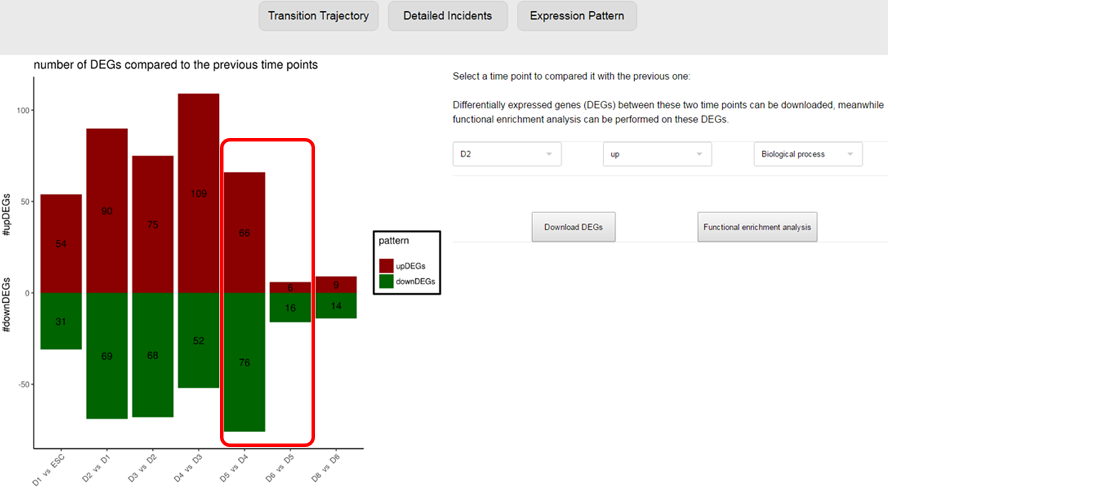
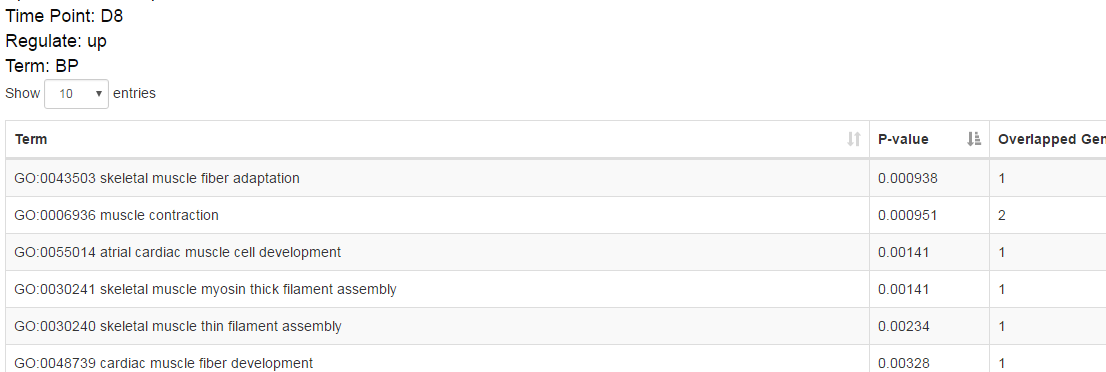
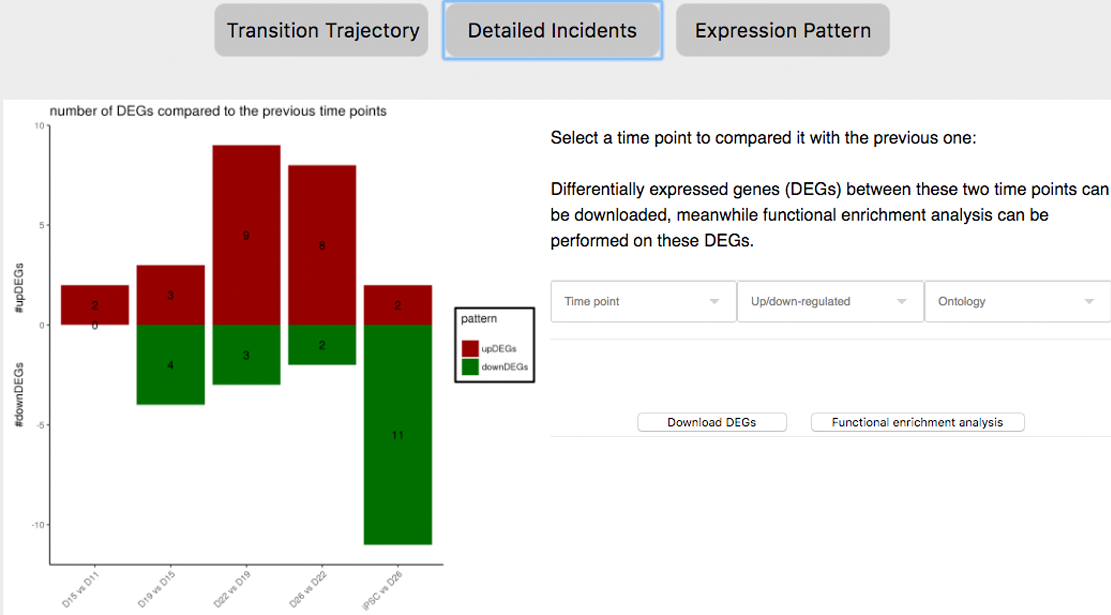
The detailed incidents will also be performed on these overlapped genes to reveal the time points these queried genes differentially express, i.e. may regulate the transition, and to reveal the functions of the queried genes that differentially express at different time points, which benefits explaining the mechanism these queried genes take effect. ⇓
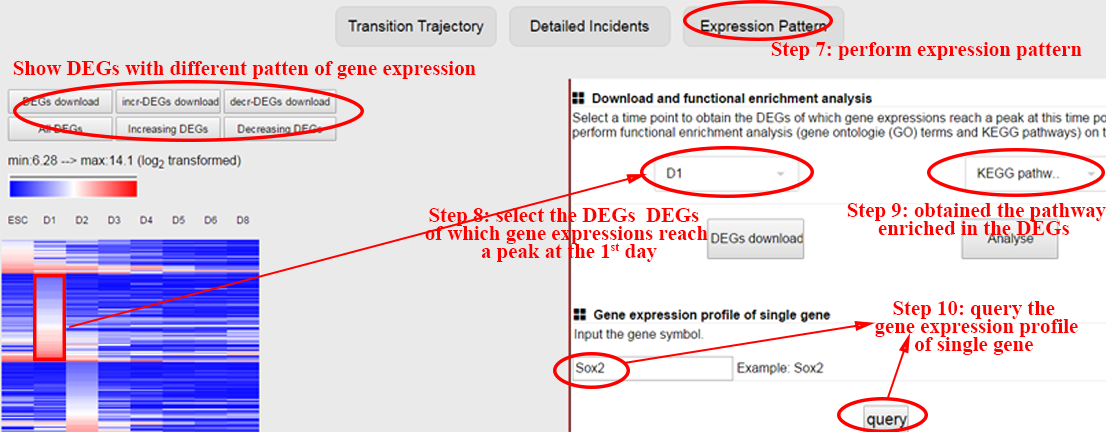
The expression patterns of these overlapped genes to reveal the time points these queried genes differentially express, i.e. may regulate the transition, and to reveal the functions of the queried genes that differentially express at different time points, which benefits explaining the mechanism these queried genes take effect. ⇓
There are 9 out of the 25 queried genes overlapping with the dataset-specific signature have the peak gene expression at the 26th day. ⇓
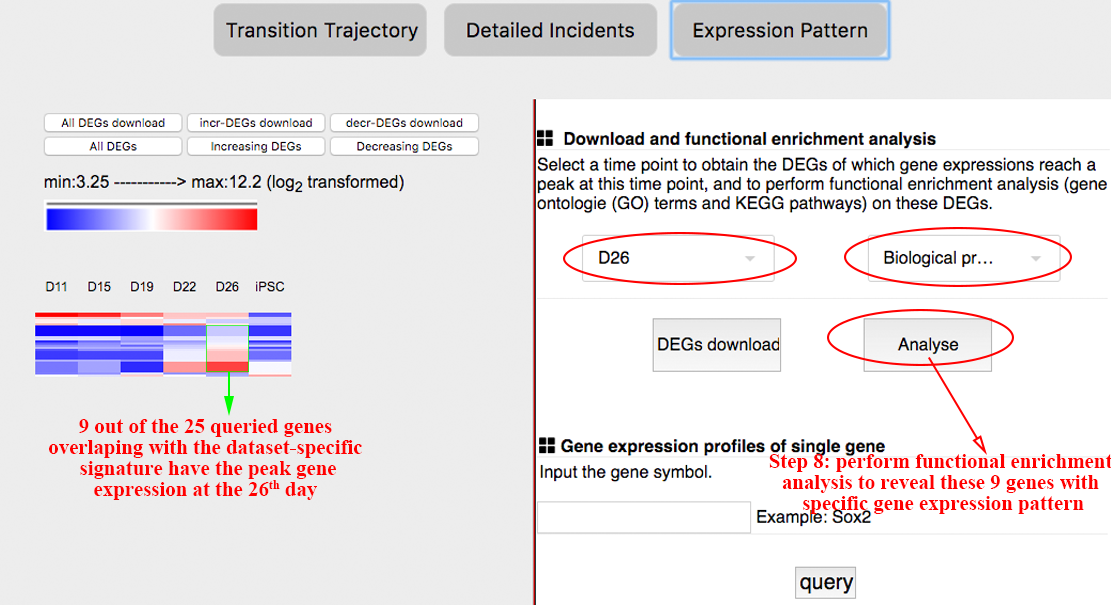
Among these 9 genes, Col2a1, Bcl11a and Insm are related to cell differentiation and organ development. These findings indicate that the 26th day may be the critical time point at which cells are converted to the desired pluripotent state. ⇓