CSTEA provides analysis and visualization of user-uploaded time-series cell state transition gene expression data.
Upload a preprocessed gene expression matrix in a .csv file to obtain the genes that play potential important roles, the trajectory of gene expression changes, and the patterns of gene expression during cell state transition. In addition, user can compare the uploaded data with datasets from previously studies.
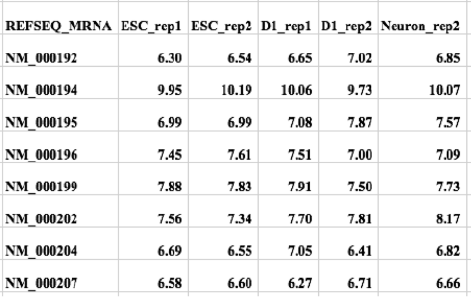
Format requirements: 1. The gene expression matrix is prefered as log2 transformed.2. The comma separator is used in .csv file
3. The names of samples in the first row are formatted as [timePoint/cellName]+[_]+[rep]+[number], e.g. ESC_rep1 and D1_rep2, in which the [rep]+[number] represents the number of replicates.4. The columns representing different samples are arranged by time.
Example .csv file (download) :